Tableau Course & Certification
MindForge Provides 100% Placement Assistance IT Courses

Earn certification from EduCADD THINKWorks, India’s most trusted educational institution with over 25+ years of excellence, in collaboration with MindForge and the National Skill Development Corporation (NSDC). Pursue a high-paying career in Tableau with MindForge Infotech’s new Tableau Course and gain a competitive edge in the job market
-
HIGHLIGHTS
- CURRICULUM
- CERTIFICATION
- JOB OPPORTUNITIES
- ABOUT US
The Tableau Course is designed to equip individuals with the skills to visualize and analyze data using Tableau, one of the leading data visualization tools in the industry. This course covers everything from the basics of data connection and preparation to creating advanced, interactive dashboards and visualizations. Participants will learn how to connect Tableau to various data sources, clean and manipulate data, and develop insightful visualizations that can effectively communicate trends, patterns, and insights. Through hands-on projects, students will gain practical experience in using Tableau’s drag-and-drop interface to create charts, graphs, and dashboards that are both informative and visually compelling.
In addition to technical skills, the course focuses on best practices for data storytelling and design principles to ensure that visualizations are clear, impactful, and tailored to the audience. By the end of the course, participants will be able to design and publish dashboards, share insights across teams, and integrate Tableau with other business intelligence tools. This training is ideal for professionals in data analysis, business intelligence, and data science, providing them with the skills to transform raw data into meaningful, data-driven decisions. The course prepares learners for roles such as Tableau Developer, Data Analyst, and BI Consultant in industries ranging from finance and marketing to healthcare and technology.
Tableau Course - Curriculum
- What is Data Visualization?
- Scope of Data Visualization
- Tableau Visualization Engine
- Various Visualizations: ext Tables, Pie Charts, Bar, and Line
- Visualizations: Heat Maps, Side by Side Lines, Highlight Tables, Circle Plots
- Visualizations: ree Maps, Area Charts, Dual Charts, Scatter Plots
- Tableau Workspace
- Dashboard and the Startup Quadrant
- Dashboard Tricks: Reference Lines, Droplines, and Tooltips
- Understanding Data Connections
- How to connect to Tableau Data Server?
- Data Connections: Joining and Blending
- Defining a Join
- Various Kinds of Join
- Usage of Join
- Right Outer Join
- Custom SQL Enabled
- Data Blending and Tableau
- Usage of Data Blending
- Data Blending in Tableau
- What is Kerberos Authentication?
- Working of Kerberos Authentication
- How to Organize and Simplify Data?
- What is Filtering?
- How to Apply a Filter to a View?
- Filtering on Dimensions
- Totals and Subtotals
- Aggregating Measures and Data Spotlighting
- String Functions and Logical Functions
- How to Sort Data in Tableau?
- Combined Fields
- Group and Aliases
- Advanced Table Calculations
- Calculated Fields and Table Calculations
- Quality Assurance for Table Calculations
- Hierarchies and Sets
- Tableau Bins
- Fixed Size and Variable Sized Bins
- Drilling and Drilling Methods
- Aggregations
- Formatting and Annotations
- Spatial Analysis and Geo-Coding
- Chart Types: Motion Charts, Gantt Charts
- Box and Whisker Plots
- Mapping and Locations
- Pan Zoom Lasso and Radial Selection
- Studying Retail Sector Forecasting
- Building and Analyzing Box Plots
- How to work with Large Data Sources in Tableau?
- Understanding and Implementing Pivot and Split
- Real-World Retail and its Data
- Data Source Filters
- Trendlines
- Advanced Timeseries Blending
- Calculating Sales Per Capita
- Forecasting in Tableau
- How to Present a Storyline?
- Creating Animations in Tableau
- Real-World Case Study: World Health Trends Investigation
- Building Visualization and Adding Animation
- Manually Sorting Blended Data
- Finalizing the Dashboard and Animations in Tableau
- Building Interactive Dashboards
- What are Action Filters?
- How to create Story Boards?
- Best Practices to create Dashboards
- Cover Pages
- Annotations
- Tool Tips and keyboard shortcuts
- Sharing work
- Tableau Online
- Tableau Reader
- And Many More…
Industry Recognized Certification
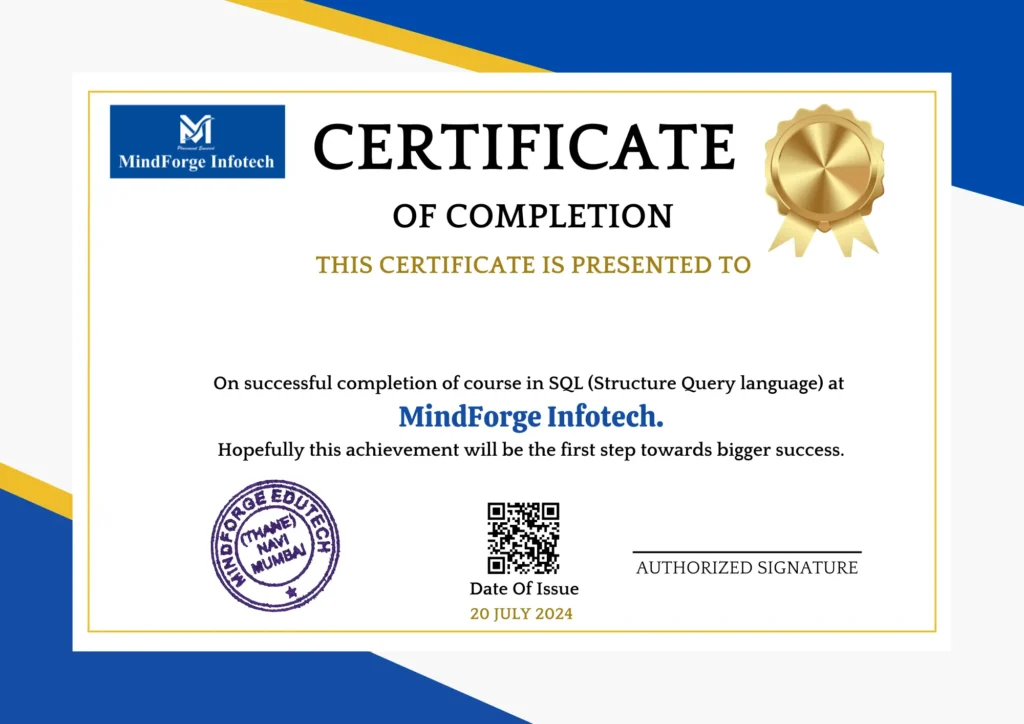
MindForge Infotech
Tableau
Career Opportunity After Completing Tableau Course
- Software Engineer
- Python Developer
- Research Analyst
- Data Analyst
- Data Scientist
- Software Developer
- Data analytics
- Cell and UI development
- BigData Analyst
- Business Analyst
- Data Research Analyst
- IT Consultant Desktop Application Developer
Global Leaders In Training
MindForge Infotech is in association with EduCADD & ThinkWorks Infotech, pioneers in skill-based learning for over 2 decades as a software training institute. MindForge is an idea derived with a vision to make quality Tech skill-oriented education available and affordable to every job aspiring youth of the nation. MindForge vision is implemented by relentlessly staying up with latest technology trends across the education value chain covering Grooming, Assessment, Industry ready skills and Soft skills to match requirements of industry today.
Our Amenities:
- Free Demo Lecture
- Unlimited Placement Assistance
- Study Materials
- Training from Industry Expert
- Assignment
- Mock Interviews
- Live Projects
- Global Certification
- Guidance & Preparation
- Personality Development Seminars
- Industry Guidance
- Free Online Workshops
- Career Guidance
- Workshop Guidance to crack Interviews
Related Courses
Why Choose MindForge Infotech
Industry-Expert Instructors
Learn from seasoned professionals with real-world experience in the IT industry.
Flexible Learning Options
Choose between online and in-person classes to suit your schedule and learning preferences.
Hands-On Training
Gain practical skills through hands-on projects and real-world case studies.
Certification Preparation
Prepare for industry-recognized certifications that enhance your employability and career prospects.
Job Placement Assistance
Benefit from dedicated career services, including job placement support and internship opportunities.
Lifetime Access to Materials
Enjoy lifetime access to course materials, ensuring you can revisit and refresh your knowledge anytime.
Our Alumini Speaks


Best Tableau Training in Navi Mumbai
Best Tableau Training in Navi Mumbai
Our Students Placed In



FAQ
We offer a variety of IT training courses, including web development, data science, cybersecurity, cloud computing, and more.
You can enroll in a course by visiting our website, selecting your desired course, and following the registration process. For assistance, you can contact our admissions team.
Prerequisites vary by course. Some courses require basic computer knowledge, while others may require specific programming skills. Check the course details for specific requirements.
Yes, we provide a certificate of completion for all our courses. Additionally, some courses prepare you for industry-recognized certifications.
Yes, we offer both online and in-person classes to accommodate different learning preferences.
Course fees vary depending on the program. You can find detailed pricing information on our website under each course description.
Yes, we have a dedicated career services team that provides job placement assistance, resume building workshops, and interview preparation.
Course durations vary. Some are short-term, lasting a few weeks, while others are longer and can span several months. Check the course details for specific timelines.
Yes, we offer flexible payment plans and EMI options for eligible students. Please contact our financial aid office for more details.
